Guide · Efficiency, margin and productivity
The P&L statement shows where your department moves the result.
A 6-step way to read the P&L without being in finance, find the lines your department moves and recognize the signs of problems and opportunities.
Out of every US$100 sold, US$4.50 is left as profit.
The P&L of an example electrical supplies distributor, as % of revenue
- Net revenue100%
- Cost of goods sold (COGS)−65%
- Gross profit35%
- Commissions and freight−6%
- Contribution margin29%
- Fixed expenses−18%
- EBITDA11%
- Depreciation and amortization−2%
- Operating income (EBIT)9%
- Interest expense−2.5%
- Income tax expense−2%
- Net income4.5%
The question
Which line of the P&L does your department show up on? If you run sales, operations, marketing or people and can’t answer, you’re making calls without seeing the scoreboard. The P&L statement, also called the income statement, is the document that shows whether the company made or lost money over a period.
Not being able to read one is more common than it seems. Karen Berman and Joe Knight, authors of Financial Intelligence, gave a 21-question finance test to US managers outside the finance function.
Managers outside finance scored 38% on a basic test.
21-question test given to nonfinancial managers in the United States, in %
Most of them couldn’t tell profit from cash either. At GE, I was responsible for the aftermarket P&L of two business units in Latin America, and I came from technology and process improvement. There, the P&L was read in margins: sales margin, contribution margin, operating margin. What I learned there applies to any executive: whoever reads the P&L finds out where their own department helps or hurts the result.
What the P&L statement shows
The P&L starts at revenue and works down to the bottom line. Along the way it stops at three profit lines: gross profit, operating income and net income. Divided by revenue, each one becomes a margin, and margins are how you compare one month with another or one company with another. A management P&L adds two more stops: contribution margin and EBITDA.
Each stop in the P&L answers a question.
The management P&L of the example electrical supplies distributor, line by line
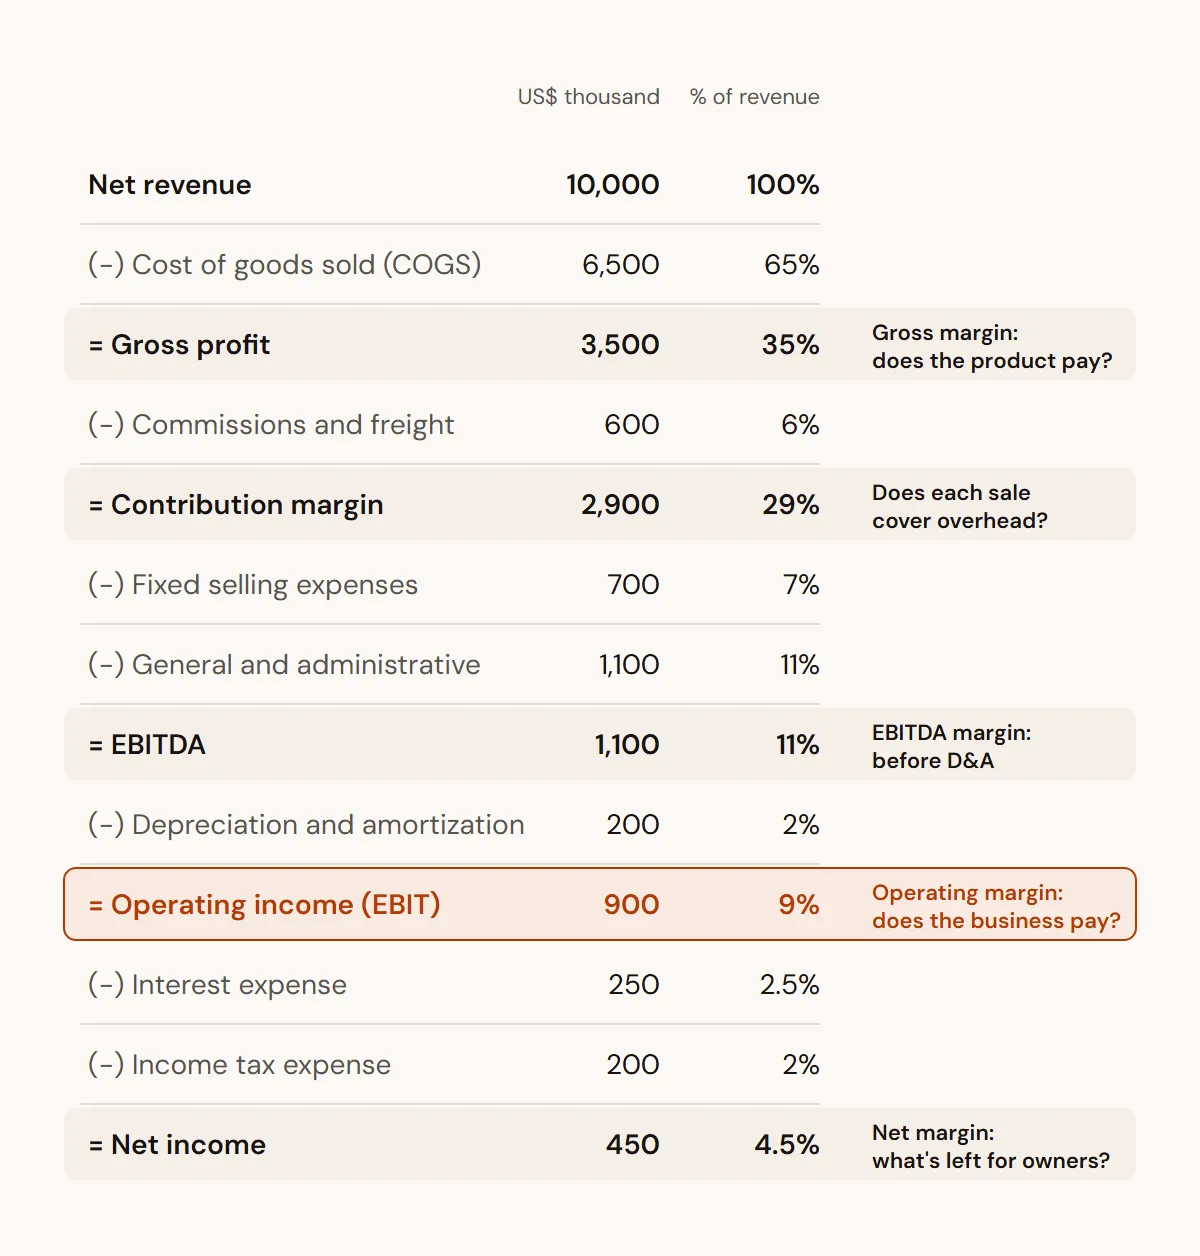
Gross profit is revenue minus cost of goods sold, or COGS. If gross margin is weak, no savings further down will rescue the company. Contribution margin also takes out what varies with each sale, such as commissions and freight, and shows how much each sale leaves to pay for the structure. EBITDA is earnings from operations before depreciation and amortization, and investors and lenders use it widely to compare companies. Operating income, also called EBIT, shows what the business earns before interest and taxes, which makes operating margin the best gauge of how well it’s run. Net income is the bottom line, what remains after everything.
Who moves each line
No line of the P&L belongs to finance alone. Finance records the numbers, and the other departments produce them.
Every line of the P&L has a department that moves it up or down.
The lines of the example P&L, who moves each one most and how much it weighs in revenue
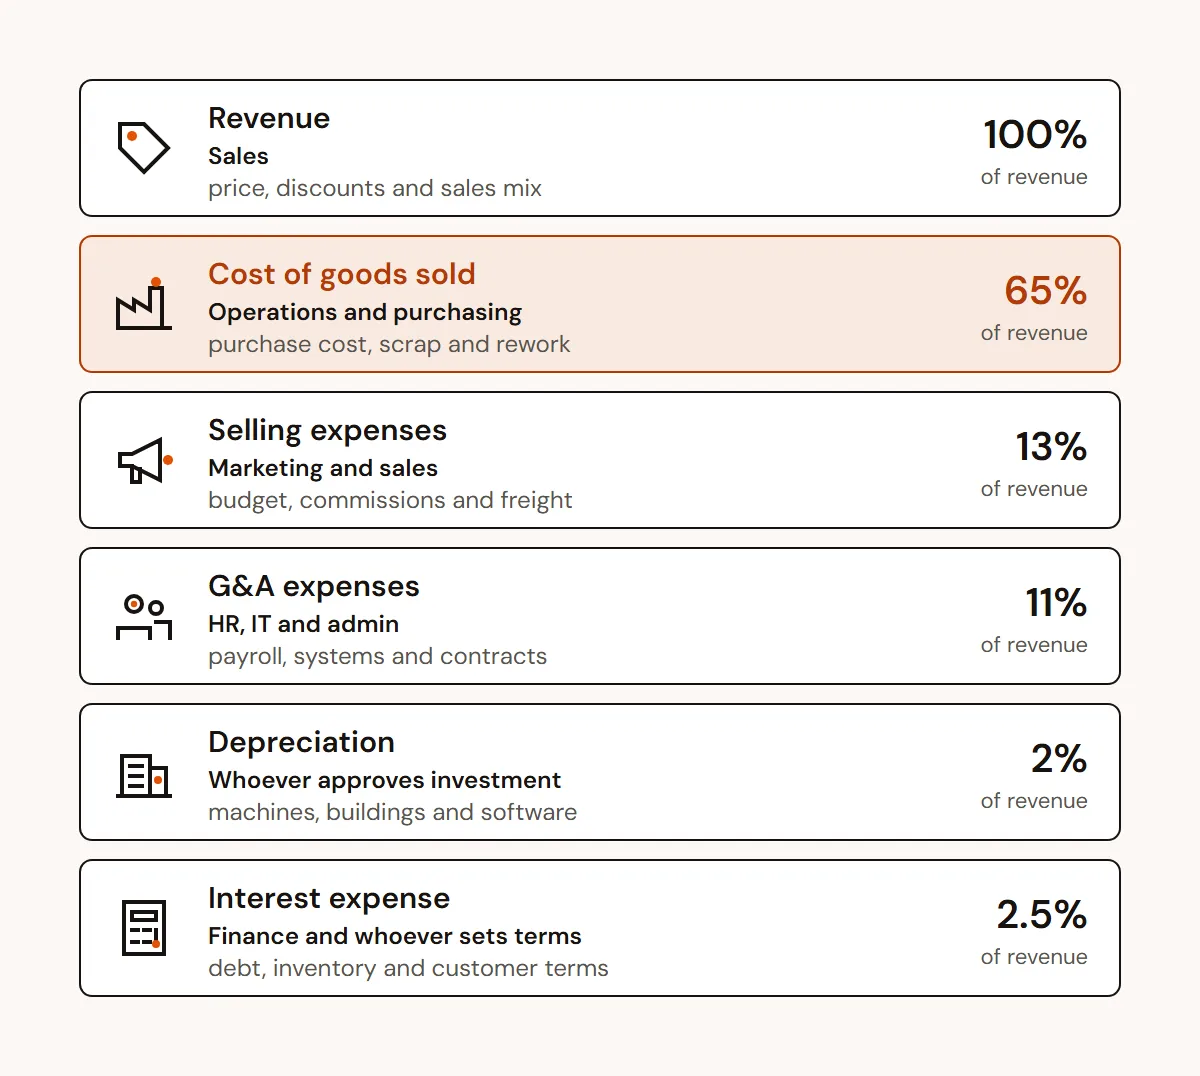
The weight of each line tells you where to look first. At the example distributor, which sells cable, circuit breakers and light fixtures to builders and electricians, COGS takes 65% of revenue. One percentage point there is worth more than five points on most expense lines.
When to use it
Every month, at the close. Before approving a discount, a hire or an investment. And whenever revenue grows and profit doesn’t keep up.
Step by step
- Check what you’re holding. See which company or unit the P&L covers, what period it spans and whether the numbers are actual or projected. It sounds obvious, and it’s where many meetings start off wrong.
- Read from top to bottom, stopping at each profit line and its margin. Gross profit, contribution margin, EBITDA, operating income and net income. In a minute you know whether the problem is in the product, the structure or the debt.
- Put every line as a percentage of revenue. The dollar amount misleads when the company is growing. The percentage shows whether a line weighs more or less than it used to.
- Compare with the budget and with the prior year. The gap between plan and actual is what deserves a question. Financially savvy managers identify the variances and find out why each one happened.
- Find your lines. Ask finance what goes into each line your department influences. The head of sales needs to know what’s inside “selling expenses.” The head of operations needs to know what makes up COGS.
- Ask what’s behind the number. Profit is an estimate. Accounting matches each cost to the revenue it helped generate, and that takes criteria and judgment calls. Before acting on a variance, confirm whether the criteria changed.
An illustrative example
The electrical supplies distributor closed 2026 with US$10 million in revenue, 8% more than in 2025. Leadership celebrated the sales number. Operating income, however, fell from US$1.1 million to US$900,000.
Revenue grew 8%, and operating margin lost 3 points.
P&L lines of the electrical supplies distributor, as % of revenue
Reading in percentages shows the path. Gross margin lost 2 points, a sign of deeper discounts to builders or of cable that got more expensive as copper prices rose. Selling expenses gained 1 point, because the team grew ahead of sales. The two moves took 3 points off operating margin. In dollars, the company sold US$740,000 more and earned US$210,000 less.
With the P&L in hand, each executive can work out what 1% on their own lever is worth.
One percent on price is worth almost 4 times one percent on expenses.
Increase in operating income from a 1% improvement on each lever, in %
The math holds for the example, with operating income at US$900,000. One extra point of discount runs the other way: it takes US$100,000 straight out of profit, or 11% of it. That’s why the end-of-month discount given to hit the target costs so much.
Signs of problems and opportunities
Some patterns repeat from company to company. Each one points to a question.
Each signal in the P&L points to a question.
Six patterns that repeat and what to investigate for each
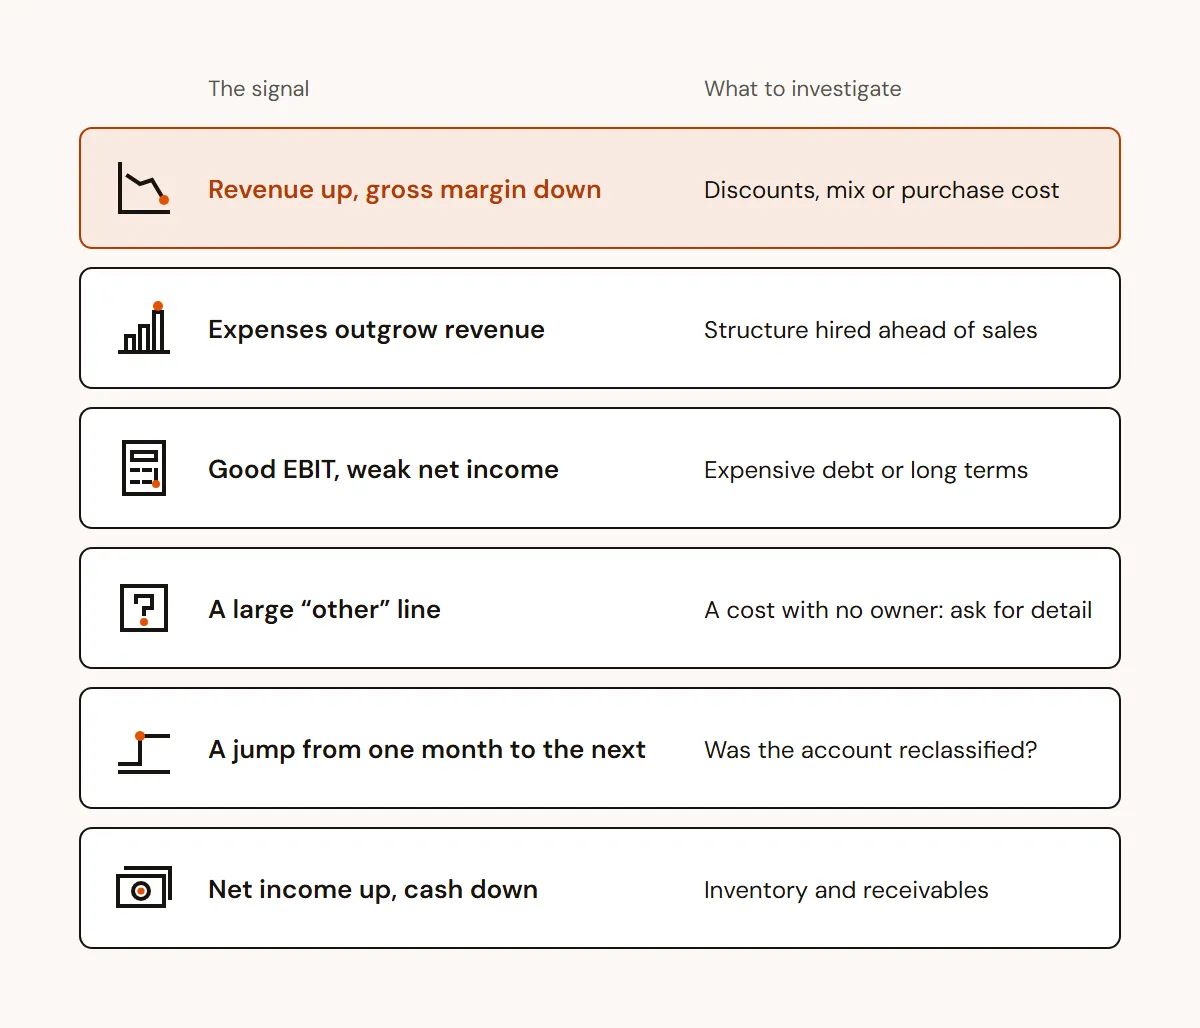
The opportunity tends to be in the detail. Ask for the P&L broken down by product line or by customer and look at the contribution margin of each one. A line that looks like a loss may be helping to pay the fixed costs. Another that sells a lot may lose money on every unit.
Part of COGS also starts outside purchasing. Rework and returns land there, and office waste inflates expenses.
What the P&L doesn’t show
The P&L is not cash. Revenue is recorded when the sale is made, even if the customer pays in 60 days. Cost is recorded when the product is sold, even if the purchase was paid for months earlier. A company can show a profit on the P&L and run out of money for payroll. That’s why the P&L is read alongside the cash flow statement.
The most common mistake
Looking only at the bottom line and reacting by cutting expenses. Berman and Knight point out that there are only three ways to improve profit: sell more at a margin, lower the cost of what you sell and cut expenses. Cutting is the only one that works fast, which is why it’s the most used. They cite Al Dunlap, the American executive nicknamed “Chainsaw Al” for mass layoffs that pumped up the earnings of the companies he took over. At Sunbeam, the tactic lifted earnings and the share price, but the company became too expensive to sell, its problems surfaced and the board forced him out.
Whoever reads the upper lines gets to the problem sooner, and rarely needs the chainsaw.
Do this tomorrow
Ask for the P&L for the last 12 months with a percent-of-revenue column next to each line. Mark the lines your department moves and check whether each one went up or down against the prior year.